




Listen to the latest episode of Credit Exchange with Lisa Lee
Published in London & New York
10 Queen Street Place, London
1345 Avenue of the Americas, New York
Creditflux is an
company
© Creditflux Ltd 2026. All rights reserved. Available by subscription only.


Data Secondary
Secondary trading rebounds as liquidity improves and spreads tighten
September was a normalisation rather than a return to the spring peak
Demand remains firm despite lower overall activity
September’s total secondary trading volume of USD 3bn was up from August’s 2.44bn and July’s 2.77bn. It was also above April’s 2.67bn but well below the exceptionally active January to March. March remains the clear high-water mark for 2026, with USD 5.38bn of secondary trading. February generated 3.87bn and January 3.48bn. It is a normalisation towards healthier trading levels rather than a return to the Q1 peak. The composition of activity is also noteworthy. The rebound was heavily driven by triple A and triple B securities, while lower-volume double A and double B trading was more subdued.
1: Traded US BWIC volumes
2: US BSL CLO DMs MoM (bps)
Rebounds in secondary trading across the capital structure reflect stable risk appetite
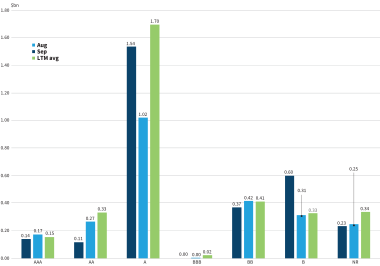
September secondary trading volume increased across several important rating categories.
Triple A trading rose to USD 1.54bn, up from 1.02bn. This is significant, given that activity declined sharply over the summer. September volume, however, remains below the USD 1.70bn LTM average, indicating that senior activity has not returned to the strongest levels earlier in 2026.
The biggest percentage increase was in triple B securities. Trading reached USD 601m in September, nearly doubling August’s 311m.Single A-rated volume declined to USD 139m, from 171m, while double A trading fell sharply to USD 115m, versus 267m in August. Double B trading also fell, from USD 417m to 371m. However, turnover is close to its USD 413m LTM average.
Total trading volume of USD 3bn was above August and July but well below the exceptionally active January to March.
Primary issuance remains active
Primary CLO issuance remained healthy in September, although BSL issuance slowed from August.
September BSL issuance totalled USD 7.28bn, compared with 15.08bn in August. The number of BSL deals fell from 33 to 16. Middle-market issuance, however, remained relatively stable at USD 2.46bn, versus 3.14bn in August.
Issuance was therefore lower than the exceptionally strong August pace but remains consistent with an active 2026 primary market. The continued availability of new-issue supply provides investors with an alternative to the secondary market and remains an important source of liquidity for the broader CLO ecosystem.
3: US CLO BWICs trends
Liquidity at strongest level of the year
About USD 2.99bn of the 4.26bn posted volume traded, producing a 70.3% traded-to-posted ratio. That compares with 59.5% in August and 57.2% in July.
September had the second-highest execution ratio of 2026, narrowly behind the 71.3% of March. This is significant because posted volume itself increased only moderately. The higher conversion rate indicates that buyers were more willing to transact on available BWIC supply rather than simply reflecting an increase in bonds being offered. The 2026 average traded-to-posted ratio is 60.3%, meaning September was more than 10 percentage points above the year-to-date average.
4: Traded US CLO equity
CLO activity remains muted
CLO equity trading was relatively subdued in September. Equity volume totalled USD 231m, down from 247m in August and July’s 301m. The number of positions traded increased from 15 in August to 24 in September, suggesting broader participation despite the relatively modest total dollar volume. The current level is well below May, when CLO equity volume exceeded USD 1.2bn across 97 positions. September reflects a more selective equity market rather than a broad return to the aggressive repositioning earlier in 2026.
5: TRACE broker-dealer aggregate CLO/CDO flows
Dealer selling continues but pace moderates
Dealer positioning remains cautious. Dealers recorded USD -116m of net flow in September, following heavier selling of -1.33bn in August and July’s -946m. This represents a substantial improvement in dealer positioning, even though dealers remained net sellers. Cumulative dealer flow for 2026 is at USD -3.58bn, compared with -3.47bn at the end of August.
The figures suggest that dealer balance sheets continued to move toward a more neutral position in September. The reduction in selling is consistent with the improvement in liquidity and tighter spreads.
For further information, contact Jacob Krayn, head of business development, Kopentech: Jacob.Krayn@kopentech.com
Source for all data: Kopentech, TRACE
