




Listen to the latest episode of Credit Exchange with Lisa Lee
Published in London & New York
10 Queen Street Place, London
1345 Avenue of the Americas, New York
Creditflux is an
company
© Creditflux Ltd 2026. All rights reserved. Available by subscription only.


Data Secondary
Secondary trading slows and execution falls as spreads send a mixed signal
Decline in proportion of BWIC volume that traded is a concerning development
Secondary trading slows after last month’s recovery
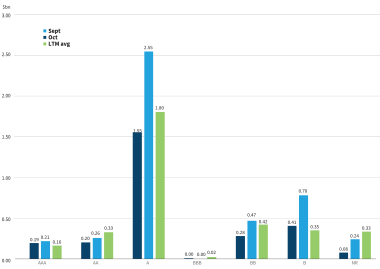
Secondary trading volume declined across every major rating category through 23 October.
Triple A trading totalled USD 1.55bn, a decline of 39%. Double A activity fell from USD 257m to USD 198m, while A-rated trading declined from USD 214m to USD 192m.
The largest dollar decline outside triple A was in triple B securities. Trading volume fell from USD 780m in September to USD 408m in October, a reduction of nearly 48%. Double B activity also weakened, declining from USD 465m to USD 282m.
The decline is particularly notable in triple A securities. Triple B activity, by contrast, has already exceeded its historical monthly average of USD 348m.
Traded US BWIC volumes
US BSL CLO DMs MoM (bps)
Secondary spreads send a mixed message
Spread movements during October suggest that the market has not shifted uniformly towards greater risk aversion.
Triple A discount margins tightened from 123.1 basis points in September to 122.8bps. Senior CLO spreads therefore remain close to the tighter end of their historical range. Double A spreads widened from 162.2bps to 162.8bps. A-rated spreads rose from 188.2bps to 202.6bps.
Further down the capital structure, the direction was more constructive. Triple B spreads tightened from 332.0bps to 325.3bps, a reduction of 6.7bps. Double B discount margins narrowed sharply from 613.4bps to 580.2bps, a tightening of 33.2bps.Double B spreads have now retraced much of August’s sharp widening. Double B discount margins fell to 613.4bps in September and have tightened further in October.
October’s observations are based on securities that have traded so far. The figures are indications of market pricing rather than proof that every tranche has had the same repricing.
Execution efficiency deteriorates as trading slows
The most concerning secondary-market development is the decline in the proportion of posted BWIC volume that ultimately traded, USD 2.71bn of USD 5.28bn, producing a traded-to-posted ratio of 51.3%. That compares with 64.1% in September, 59.5% in August and 57.2% in July.
October’s reading is also
below the 2026 year-to-date average of 59.2% and the 61.5% ratio recorded for 2025.
This suggests that a smaller proportion of offered securities has found buyers at clearing levels acceptable to sellers.
US CLO BWIC trends
TRACE activity moderates from September’s high levels
Broader TRACE activity has declined from September’s elevated levels. Investment-grade CLO TRACE volume totalled USD 20.96bn in October, compared with USD 30.41bn in September. High-yield volume reached USD 1.96bn, against USD 4.25bn in September (partial-month figures, not final totals).
IG TRACE volume increased from USD 20.61bn in August to USD 30.41bn in September, although it remained below March’s exceptional USD 39.86bn.
October’s lower turnover reverses September’s momentum rather than showing the market has returned to the exceptionally active first quarter.
Traded US CLO equity
Dealer selling intensifies again
Dealers recorded USD 1.06bn of net selling in October, following USD 389m in September. This represents a substantial reversal from September’s improvement. The cumulative dealer position for 2026 has deteriorated to USD -4.92bn, compared to USD -3.86bn at the end of September. Renewed selling comes alongside lower trading volume and a declining traded-to-posted ratio.
This suggests the market is absorbing continued dealer supply in an environment where execution has become less efficient.
TRACE broker-dealer aggregate CLO/CDO flows
CLO equity trading continues to normalise
CLO equity activity has continued to decline following the substantial trading volumes earlier in 2026.
October equity volume totalled USD 75.7m through available observations, from USD 242.2m in September. Traded positions fell from 26 to 11. This follows a prolonged decline from May, when trading reached USD 1.21bn across 97 positions. June volume was USD 524m, followed by USD 301m in July, USD 247m in August and USD 242m in September. The extraordinary equity repositioning in the spring has not returned.
For further information, contact Jacob Krayn, head of business development, Kopentech: Jacob.Krayn@kopentech.com
Source for all data: Kopentech, TRACE
