




Listen to the latest episode of Credit Exchange with Lisa Lee
Published in London & New York
10 Queen Street Place, London
1345 Avenue of the Americas, New York
Creditflux is an
company
© Creditflux Ltd 2026. All rights reserved. Available by subscription only.


Opinion CLOs

Does a manager’s track record reflect skill – or risk appetite, timing and luck?
by Dagmara Michalczuk

Dagmara Michalczuk
Co-chief investment officer
Tetragon Credit Partners
The holy grail for CLO equity investors is identifying managers capable of persistently outperforming their peers
CLO investors now have a wealth of manager performance data at their disposal. Research desks and rating agencies regularly publish statistics and rankings covering credit quality, trading performance and historical equity distributions. Yet different metrics can produce conflicting rankings, creating more noise than insight into manager quality.
The holy grail for CLO equity investors is identifying managers capable of persistently outperforming their peers. How much of a manager’s track record reflects repeatable skill rather than risk appetite, timing or luck? And how reliably does past performance predict future results?
We examined these questions in a wide study of 2,508 US broadly syndicated CLOs managed by 111 managers between January 2020 and September 2026.
To isolate asset management decisions, we considered only deals within their reinvestment periods and measured underlying portfolio performance before leverage, financing costs and fees. We calculated excess price and total returns relative to the median deal over the same period. Positive results indicated outperformance and negative results underperformance.
We found that average returns across managers varied by 30bps per year around the peer median. After adjusting for statistical noise, however, we estimated the underlying variation at only about 12bps. Just eight of the 111 managers demonstrated statistically significant differences from the median: two outperformed and six underperformed.
To isolate asset management decisions, we considered only deals within their reinvestment periods and measured underlying portfolio performance before leverage, financing costs and fees. We calculated excess price and total returns relative to the median deal over the same period. Positive results indicated outperformance and negative results underperformance.
We found that average returns across managers varied by 30bps per year around the peer median. After adjusting for statistical noise, however, we estimated the underlying variation at only about 12bps. Just eight of the 111 managers demonstrated statistically significant differences from the median: two outperformed and six underperformed.
Analysing persistence of performance
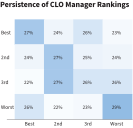
We then tested for persistence of performance. If rankings captured skill, last year’s leaders should lead again. The data, however, told us that they mostly don’t.
The correlation between consecutive annual rankings was just 0.04, where zero indicates no relationship. Only 27% of top-quartile managers remained in that quartile the following year, barely above the 25% expected by chance.
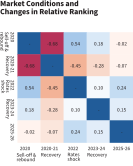
Why do rankings change so much? Our findings suggest that differences in risk positioning are an important driver. Market conditions can cause rankings to reverse. Managers that performed well during the Covid sell-off generally ranked poorly during the recovery, with a correlation of -0.68, but tended to perform well again during the 2022 sell-off, with a correlation of +0.54.
Positioning is itself a management decision. These reversals therefore do not make rankings irrelevant. They make it essential to understand the risks behind them. A defensive manager may protect capital during a sell-off but lag during a sharp recovery, while a more aggressive manager may display the opposite pattern.
Rankings do not predict future leadership
What are the key implications of these findings for CLO investors? First, manager selection remains one of the most consequential decisions a CLO investor makes, particularly at the mezzanine debt and equity level. While a 12bp-per-annum performance gap may appear small, a sustained 12bp advantage on gross assets translates into roughly 1.2 percentage points a year for an equity tranche at 10x leverage, before fees and structural effects.
Secondly, past rankings provide limited evidence of future leadership. Investors need to examine underwriting, portfolio construction, trading and credit losses across market environments. Lastly, since persistent peer-group outperformance across market environments is rare, it suggests that few CLO managers warrant premium management fees.
“Energy and persistence conquer all things,” runs the maxim often attributed to Benjamin Franklin. Yet persistence in CLO managers’ performance must be demonstrated, rather than assumed. Investors need to understand how portfolio positioning and management decisions shape each deal’s performance over time and whether apparent outperformance reflects repeatable skill, or risks rewarded by a particular market.
The strongest evidence of manager quality lies in a consistent, repeatable decision-making process that delivers value across changing market conditions.
