




Listen to the latest episode of Credit Exchange with Lisa Lee
Published in London & New York
10 Queen Street Place, London
1345 Avenue of the Americas, New York
Creditflux is an
company
© Creditflux Ltd 2026. All rights reserved. Available by subscription only.


Data Secondary
August trading slows further while spreads widen across capital structure
Initial figures point to softer trading across triple A, triple B and double B securities
Senior demand remains firm
The CLO secondary market continued to moderate with month-to-date trading volumes running below July levels and spreads widening across nearly every rated tranche.
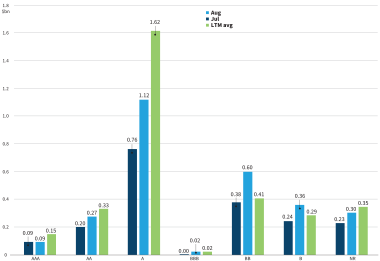
Throughout August, secondary trading totalled USD 1.91bn, against USD 2.77bn during the full month of July. The partial data nevertheless points to softer trading, particularly across triple A, triple B and double B securities.
Yet execution efficiency has not deteriorated. The traded-to-posted ratio was unchanged from July. Primary CLO issuance continued at a strong pace. The combination suggests August’s weaker turnover was driven more by reduced activity and changing risk appetite than by a breakdown in secondary-market liquidity.
1: Traded US BWIC volumes
2: US BSL CLO DMs MoM (bps)
Secondary spreads widen with lower-rated debt bearing the brunt
The more important development in August has been the direction of secondary spreads.
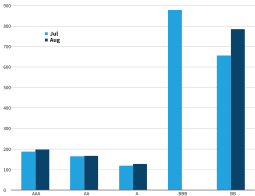
Triple A discount margins widened from 119bps in July to 126bps in August, a move of approximately 7bps. While still within the 12-month range, August’s triple A level has moved off July’s exceptionally tight level of 119bps, which represented the LTM low. The widening becomes substantially more pronounced further down the capital structure.
Double A spreads increased modestly from 165bps to 167bps, while A-rated spreads widened from 187bps to approximately 198bps. Triple B spreads increased by more than 33bps, from 374bps to 407bps. Double B securities saw the sharpest move — average discount margins widened from approximately 656bps in July to 785bps in August. The August level represents the widest double B spread in the 12-month period covered by the deck.
Secondary liquidity remained stable during August
This divergence between senior and mezzanine spreads is important. The August market is not simply experiencing a uniform widening of CLO spreads. Instead, the data indicate increasing differentiation by rating, with the largest repricing occurring in lower-rated securities.
It suggests investors are demanding greater compensation for taking mezzanine credit risk even as senior CLO paper remains relatively well supported.
Despite lower trading volumes, execution efficiency has held up well. The traded-to-posted ratio was approximately 57.0% in August, against 57.2% in July, an important counterpoint to falling headline trading volume.
3: US CLO BWICs trends
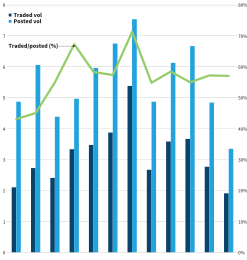
Posted volume through August 21 totalled some USD 3.35bn, with some USD 1.91bn traded. The stable conversion ratio suggests that the market continues to clear available supply efficiently despite less overall activity.
The 2026 average traded-to-posted ratio remains approximately 59%, leaving August somewhat below the year-to-date average though well above the 52% level recorded for 2025.
This distinction matters: lower trading volume does not necessarily mean deteriorating liquidity. August appears to have brought less supply and less market participation, but the supply that is being brought to market continues to transact at a relatively healthy rate.
4: Traded US CLO equity
CLO equity activity continues to normalise
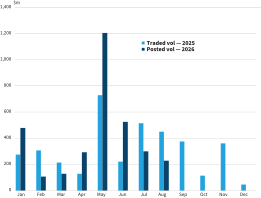
Equity volume totalled approximately USD 230m through August, compared with USD 301m in July. The number of traded positions fell substantially, from 27 in July to just 13 through August.
The decline is consistent with the broader reduction in secondary activity and follows the exceptionally strong equity trading period earlier in 2026. May remains the standout month, with more than USD 1.2bn of CLO equity trading.
August therefore represents continued normalisation rather than a new wave of equity selling.
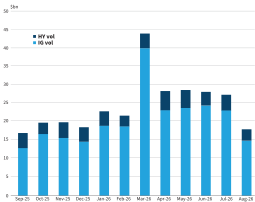
5: FINRA TRACE reported CLO/CDO volumes
TRACE activity slows across CLO markets
TRACE activity has followed the broader secondary-market slowdown. Investment-grade CLO TRACE volume totalled approximately USD 14.7bn through August, versus USD 22.9bn during July.
High-yield TRACE volume was approximately USD 3.1bn, compared with USD 4.2bn in July. Again, the partial-month nature of the August data makes direct monthly comparisons imperfect. Nevertheless, the data confirms that August has been a lower-activity period across both investment-grade and high-yield CLO markets.

For further information, contact Jacob Krayn, head of business development, Kopentech: Jacob.Krayn@kopentech.com
Source for all data: Kopentech, TRACE
